Basin Threshold Tool User Interface
1 Overview
The Basin Threshold Tool (BTT) is an interactive mapping dashboard designed to help users explore freshwater sustainability thresholds at global and local scales. The dashboard combines spatial information, basin boundaries, and threshold indicators within a single interface. Users can search for a basin or location, select a threshold layer, explore the map, and view information for an individual basin.
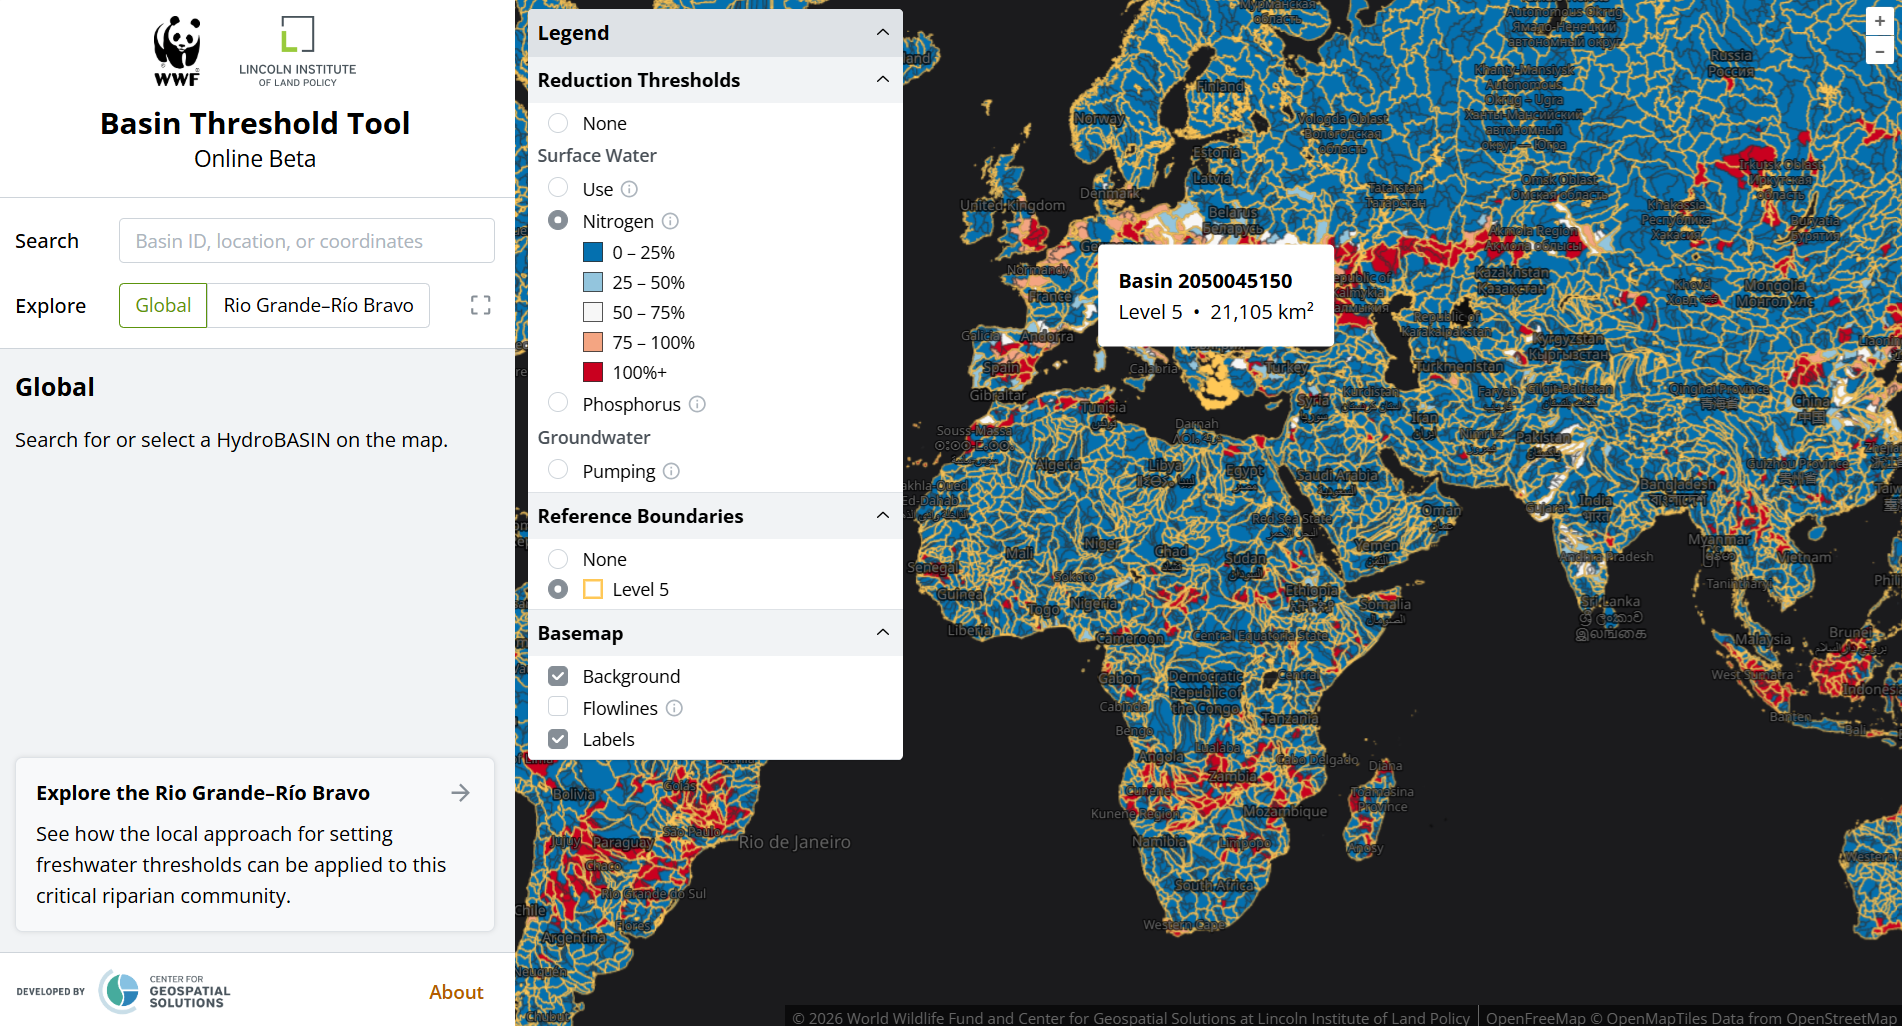
The interface consists of three principal components:
- the navigation and information panel on the left;
- the interactive map in the center; and
- the legend and layer controls displayed over the map.
3 Interactive map
The map is the primary area for spatial exploration. Basin boundaries are displayed over the basemap, allowing users to examine the geographic distribution of freshwater thresholds.
Users can interact with the map by:
- clicking and dragging to move across the map;
- using the + and − controls to zoom in or out;
- clicking a basin to select it; and
- using the search field to navigate directly to a basin or location.
The map updates when a threshold layer, reference boundary, or basemap option is changed.
4 Legend and layer controls
The floating Legend panel controls the information displayed on the map. Its sections can be expanded or collapsed using the arrow beside each section heading.
4.1 Reduction thresholds
The Reduction Thresholds section allows the user to select the freshwater indicator displayed on the map. Selecting None removes the threshold layer.
The available global threshold layers are grouped as follows:
4.1.1 Surface water
- Use: surface-water-use reduction thresholds. See the Global Freshwater Targets methodology page for more information about how these targets were calculated.
- Nitrogen: nitrogen-reduction thresholds required to meet the applicable water-quality target. See the Global Nutrient Reduction Targets for Surface Water methodology page for more information about how the nitrogen targets were calculated.
- Phosphorus: phosphorus-reduction thresholds required to meet the applicable water-quality target. See the Global Nutrient Reduction Targets for Surface Water methodology page for more information about how the phosphorus targets were calculated.
4.1.2 Groundwater
- Pumping: groundwater-pumping reduction thresholds associated with achieving stable or rising groundwater conditions. See the Global Groundwater Pumping Reduction Targets methodology page for more information about how these targets were calculated.
Only one reduction-threshold layer can be displayed at a time. The information icons beside the layer names provide additional context about the corresponding indicators.
4.2 Reference boundaries
The Reference Boundaries section controls the basin outlines displayed on the map:
- None: hides the reference boundaries.
- Level 5: displays HydroBASINS Level 5 boundaries.
These boundaries help users identify the basin units associated with the global threshold results. The spatial unit used by a specific indicator may differ; users should consult the corresponding methodology page for the spatial resolution and calculation method.
4.3 Basemap
The Basemap section allows users to turn contextual map elements on or off:
- Background: displays or hides the underlying basemap.
- Flowlines: displays or hides river and stream lines when available.
- Labels: displays or hides geographic place names.
These options do not change the threshold calculations. They only modify the contextual information visible behind the selected threshold layer.
5 Suggested workflow
To explore the dashboard:
- Select either the Global or Rio Grande-Rio Bravo view.
- Search for a basin, location, or coordinates, or navigate manually on the map.
- Choose a reduction-threshold layer from the Legend panel.
- Select the preferred reference boundary and basemap options.
- Click a basin to view its available threshold information.
- Compare other threshold layers by selecting them individually from the legend.
6 Interpretation considerations
The dashboard provides screening-level information to support freshwater target setting and spatial comparison. The mapped values should be interpreted together with the methodology for each indicator because the datasets differ in their spatial resolution, temporal coverage, reference conditions, and calculation methods.